Crystallinity through X-ray Diffraction
Jump to navigation
Jump to search
Safety
- Do not use the diffractometer without permission.
- One needs to have a plastic ring assigned to them in order to use the instrument
- Contact Dr. Ed Laitila about using this instrument
Sample Preparation
- In order for the analysis from x-ray diffraction to be effective, the sample must be flat.
- For polymers used, the samples were not flat and had to be adjusted in order to meet this requirement.
- Have a 30 mm x 80 mm sample.
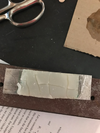
- Coat the flat part of the sample holder with a two-part resin.
- This is done by mixing the two parts together until a uniform cloudy color appears.
- Use a flat wooden stick to evenly coat the resin onto the sample holder.
- Place the sample on top of the resin.
- Place a flat glass piece over the sample
- Clean the glass with ethanol before to avoid contamination.
- Place a heavy object on top of the glass.
- This is to distribute the weight evenly across the sample.
- Let the sample sit for 1 hour for the resin to dry.
Crystallinity Analysis
- The instrument used was XDS 2000 by Scintag Inc.
- X-ray diffraction on the specimen was done by Dr. Ed Laitila.
- Settings used to obtain data were adjusted by Dr. Laitila.
- File of raw data was supplied.
- Open DMSNT software on a computer.
- Under tools, click on crystallinity
- A new window should open.
- Under file, go to new.
- Select the raw data file that was uploaded from the scan.
- The file type should be ".raw"
- An intensity vs angle spectrum will appear.
- Make sure "Crystalline" is selected in the upper left corner.
- Draw a line connecting the two ends of the base of the sharp peaks.
- The region above the base should become blue.
- Template:Clear
- Repeat this until all the sharp peaks are filled in.
- There are small peaks present on the broad peak, and would be need to be included as crystalline.
- Select "total area" from the upper left corner.
- Draw a line from the leftmost base of the spectrum to the rightmost base of the spectrum.
- Make sure the the base line is below the spectrum at all times.
- If not, reduce the length of the base line so that is underneath the spectrum.
- The region of the base should become green.
- Template:Clear
- Make sure the the base line is below the spectrum at all times.
- In the upper right corner of the spectrum, the percent crystalline will be shown.
- This corresponds to how much crystalline is present in the sample.


