Mixture DOE in RStudio
Jump to navigation
Jump to search
Loss Prevention
- Check the surrounding area for possible trip hazards from computer wires and cords.
- Keep open drinks away from the work surface or computer components.
- A drink spilling could damage the electrical components of the computer.
- Keep food with crumbs away from the computer keyboard.
- Crumbs can get lodged in between keys, limiting functionalities.
Procedure
Accessing RStudio on a campus Windows Computer
- Press the circular power button on the computer tower
- Circular button should have a green ring light up around it
- If light appears as yellow or red, continue to click the power button until it has cycled to green.
- Circular button should have a green ring light up around it
- Click the rectangular power button on the monitor
- The small dot light should flash green
- If the light appears as yellow or red, continue to click the power button until it has cycled to green.
- The small dot light should flash green
- The Windows log in screen should appear, enter your MTU ISO username and password
- In the bottom left corner of your computer screen there should be the windows icon: A set of four tetrahedrons arranged into a larger tetrahedron.Click this icon.
- Scroll down in the menu until you reach the letter "R"
- There should be a folder entitled "RStudio"
- Click on the folder once to access the contents
- The only content of the folder to appear should be the RStudio application
- Click on the folder once to access the contents
- Double click on the RStudio icon to launch the application
Accessing RStudio using a remote Windows desktop
- Open your computer
- Establish a VPN connection
- Michigan Tech IT Has a support article for how to establish a VPN connection
- In the bottom left corner of your computer screen there should be the windows icon: A set of four tetrahedrons arranged into a larger tetrahedron.Next to this icon there should be a bar that says "Type here to search"
- In the box, begin to type "Remote Desktop Connection" until the application shortcut appears.
- Double click the link to the application to open it.
- Follow the instructions provided by Michigan Tech IT to complete the connection to a Michigan Tech Remote Desktop
- Link to Michigan Tech IT Instructions: https://michigantechit.teamdynamix.com/TDClient/1801/Portal/KB/ArticleDet?ID=53387
- In the bottom left corner of your remote desktop window there should be the windows icon: A set of four tetrahedrons arranged into a larger tetrahedron.Click this icon.
- Scroll down in the menu until you reach the letter "R"
- There should be a folder entitled "RStudio"
- Click on the folder once to access the contents
- The only content of the folder to appear should be the RStudio application
- Click on the folder once to access the contents
- Double click on the RStudio icon to launch the application
RStudio Setup
Setting Working Directory
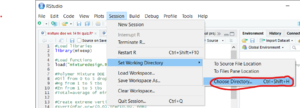
- Go to "Session" in the upper menu bar
- In the drop down list hover your cursor over the "Set Working Directory" list item
- A new list should appear to the right of the "Set Working Directory" item
- In the new list select "Choose Directory"
- File explorer will open
- Navigate to find your desired folder
- This should be the folder you plan to do all of your RStudio work in, as Rstudio will not be able to find any programs referenced in your code that do not reside in the folder set as the working directory.
Starting a new file
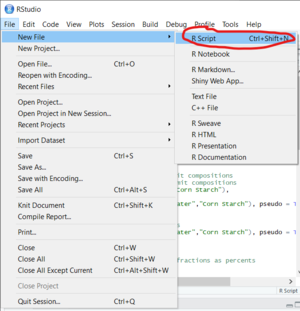
- Go to "File" in the upper menu
- Hover your cursor over "New File"
- A New Menu should appear to the right of the "New File" option in the "File" drop down menu.
- In the new menu that appears select the "R Script" option
Creating a Mixture DOE
Loading Packages
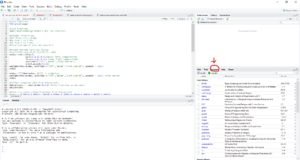
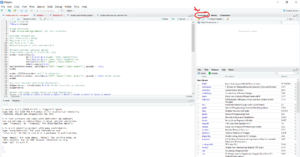
- In the bottom right quadrant of the RStudio window select the "Packages" tab
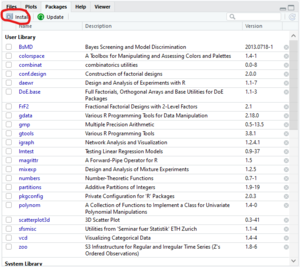
- Click on the "Install" button in the top left of the "Packages" window
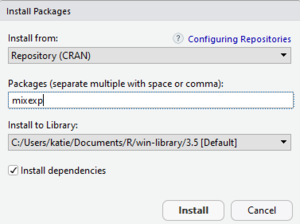
- A small popup window will appear
- In the popup window type "mixexp" into the "Packages" textbox
- In the popup window click "Install"
- Make sure "Install from:" is set to "Repository (CRAN)"
- Make sure "Install dependencies" is checked
- Don't change the "Install to Library:" drop down, this is automatically set to your current working directory
Loading Functions
- First you must the "mixturedesign.RData" file
- Download it from the following shared google drive link: https://drive.google.com/open?id=1VnECw079iu8jT6NtNja5uJg4IkRkHPlB
- Move the file from your downloads folder to the folder you have selected as your working directory.
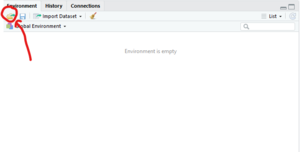
- In the upper right quadrant of the RStudio window, select the "Environment" tab.
- In the upper right corner of the "Environment" tab click on the icon that looks like a file folder with a green arrow coming out
- This will open a finder window that says "Load Workspace" at the top.
- Navigate to your working directory folder
- Select the "mixturedesign.RData" file
- Click "Open" in the bottom right of the finder window
Coding the DOE Design
- Loading libraries
- library(mixexp)
- Loading functions
- load("mixturedesign.RData")
- Create an extreme vertices design
- evdes<-Xvert(nfac=3,
- uc=c(5,6,7)/10.5,#upper limit
- lc=c(0,1,2)/10.5,# Lower limit
- axislabs=c("Oil","Water","Corn Starch")
- ndm=0,pseudo=FALSE)
- DesignPoints(evdes, axislabs=c("Oil","Water","Corn Starch"), pseudo = TRUE)
- In the example above:
- 3 is the number of factors, which for a mixture DOE is 3
- 5 is the upper limit for factor 1
- 6 is the upper limit for factor 2
- 7 is the upper limit for factor 3
- 0 is the lower limit for factor 1
- 1 is the lower limit for factor 2
- 2 is the lower limit for factor 3
- Oil is the label for the first factor
- Water is the label for the second factor
- Cornstarch is the label for the third factor
- 10.5 is the sum of the upper and lower limits divided by 2
- Display extreme vertices DOE design points
- evdes
- Change DOE points from the extreme vertices design from fractions to percents in terms of the data you plan to collect
- DOEpercents<- round(evdes*10.5,3) #View fractions as percents
- 10.5 is the sum of the upper and lower limits divided by 2
- 3 is the number of factors
- DOEpercents<- round(evdes*10.5,3) #View fractions as percents
- Display the new DOE points in terms of the data you plan to collect
- DOEpercent
Acquire DOE Point Results
- Evaluate the DOE points using whatever method desired
- actual experiments
- Thermocalc
- etc.
Coding to Acquire Mixture DOE Analysis
- Enter the results into the same RStudio code directly after the previously stated line of code
- laves<-c(1,2,3,4,5,6,7,8,9)
- The way this code is set up you should have 9 data points to enter as results in the place of the 1-9 values above.
- Ensure data is being entered in the same order as it appears vertically in the displayed DOEpercents
- Combine design and response data
- evdoe<-data.frame(evdes,laves)
- Display results of combined design and response data
- evdoe
- Create and analyze model
- Create model
- quadratic=lm(laves ~ -1 + (x1+x2+x3)^2,data=evdoe)
- Add the ANOVA for the model
- Anova(quadratic,type=2)
- View the regression equation
- summary(quadratic)
- Create model
- Begin to remove insignificant factors from model, until all remaining factors are significant
- An example of a reduced model is shown below:
- quadratic=lm(laves ~ -1 + (x1+x2+x3)^2,data=evdoe)
- Anova(quadratic,type=2)
- summary(reduced)
- Refer to the pdf link shared below on how to determine if a factor is significant
- An example of a reduced model is shown below:
- Produce the mixture plot
- ModelPlot(reduced, dimensions = list(x1="x1",x2="x2",x3="x3"),
- contour=TRUE, fill=TRUE,
- axislabs=c("Oil", "Water", "Corn Starch"),
- cornerlabs = c("Oil", "Water", "Corn Starch"))
- In this case:
- Oil is the first factor
- Water is the second factor
- Corn Starch is the third factor
- ModelPlot(reduced, dimensions = list(x1="x1",x2="x2",x3="x3"),
- Add constraints to the mixture plot
- Determine constraints
- c(1.25,1.75)/10.5 #Factor 1
- c(2.25,2.75)/10.5 #Factor 2
- c(4.5,5.5)/10.5 #Factor 3
- In this case:
- The values in parenthesis are the points from your extreme vertices setup
- The 10.5 is the sum of the max and min values divided by 2 (as used above)
- Determine constraints
- Show the whole region plotted with the limits
- ModelPlot(reduced,dimensions = list(x1="x1",x2="x2",x3="x3"),
- lim=c(0.14,0.19,0.25,0.31,0.50,0.61),
- constraints=TRUE,
- contour=TRUE, fill=TRUE,
- axislabs=c("Oil", "Water", "Corn Starch"),
- cornerlabs = c("Oil", "Water", "Corn Starch"))
- In this case:
- The values in parenthesis are the points from the determined constraints above
- Oil is the first factor
- Water is the second factor
- Corn Starch is the third factor
- ModelPlot(reduced,dimensions = list(x1="x1",x2="x2",x3="x3"),
- Show the plot of the results zoomed in on the region of interest
- ModelPlot(reduced,dimensions = list(x1="x1",x2="x2",x3="x3"),
- lim=c(0.14,0.19,0.25,0.31,0.50,0.61),
- constraints=TRUE,
- contour=TRUE, fill=TRUE,
- axislabs=c("Oil", "Water", "Corn Starch"),
- cornerlabs = c("Cu", "Mg", "Zn"),pseudo=TRUE)
- In this case:
- The values in parenthesis are the points from the determined constraints above
- Oil is the first factor
- Water is the second factor
- Corn Starch is the third factor
- ModelPlot(reduced,dimensions = list(x1="x1",x2="x2",x3="x3"),
Mixture DOE Coding Resources
- A sample code is linked below via google drive
- Additional clarification and resources can be found in the power point linked below via google drive
